Introduction to DigitalRockArt
Contents
The purpose of this web site is to support the development of software for recording rock art. DigitalRockArt is an experimental application designed for three groups of users:
- Land managers or owners
- Rock art recorders
- Rock art researchers
The DigitalRockArt application can be described as a web-based photo album integrated with an SQL relational database. The relational database is used to create standardized reports and to facilitate research across multiple rock art sites.
The goal of the application is to explore ways to facilitate recording large numbers of rock art sites with the use of volunteer recorders. To date, the application has been used to record 120 Arizona rock art sites. The database is comprised of approximately 10,000 digital images, 7,000 rock art panels, and 21,000 rock art elements.
Field Recording
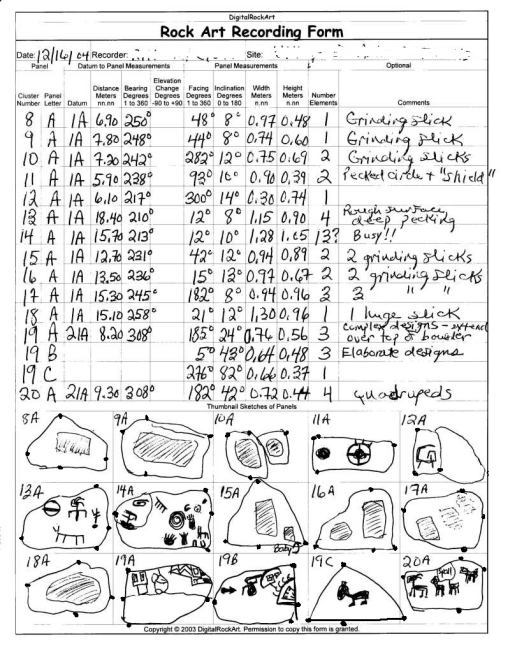
Field recording using the DigitalRockart system is less labor intensive because much of the work is moved from the field to the computer keyboard. Recording teams are small, usually two, three, or four people. Panel clusters 1 are marked with reusable zip-lock bags containing a numbered index card and a few local pebbles for weight. The photographer shoots every panel at different times during the day trying to capture each panel in the most favorable light. Mug boards, metric scales, and north pointing arrows are not used. The ground survey is completed using only one form. A typical day's recording by a team of two people will produce about 4 pages of forms and 400 digital images.
 |
Experienced rock art recorders accustomed to using traditional recording methods with a half dozen or more field recording forms may view the use of only one field recording form with skepticism. There are more forms that will be filled out later while looking at digital images and keying data directly into a computer. Because a discussion of how to fill out forms can be tedious, the next topic will discuss what kinds of reports can be produced with the data that is collected.
Clusters are groups of panels, for example, a boulder. (1)
Reporting
The details of how data is entered into the DigitalRockArt application is described later. One big advantage of using a web based application for rock art recording is the standardized reporting that is available immediately after entering the data.
The DigitalRockArt application produces many reports that may be viewed via the internet. Access to survey reports may be blocked or limited (site names and numbers suppressed) based upon login IDs. Individuals identified as members of a recording team have full access to view all surveys recorded by their team. Land managers may grant individual users the authority to view all of their surveys.
The DigitalRockArt application has the capability of copying all reports for one or more sites to DVD media. This constitutes a permanent record independent of the DigitalRockArt web site that may be distributed to the recording team and land managers or owners. Sample reports from the first rock art site recorded using DigitalRockArt may be viewed by clicking the hyperlinks below. If you prefer to read the instructions on how to use the reports first, read
![]() RockArtInventory
.
RockArtInventory
.
![[New window]](/wikidata/newwindow.png) Survey Report
- a narrative describing the most important aspects of the site.
Survey Report
- a narrative describing the most important aspects of the site. ![[New window]](/wikidata/newwindow.png) All Elements
- small sized elements are shown sorted by the element class. Clicking the element will display the original image.
All Elements
- small sized elements are shown sorted by the element class. Clicking the element will display the original image. ![[New window]](/wikidata/newwindow.png) All Images
- small images are shown sorted by category, cluster, and panel. Clicking the image will show it in a larger size. A zoom function shows the full detail of the original image. On the larger images, site or cluster overviews that were annotated as part of the recording will include hyperlinks that may be clicked to show additional detail and data.
All Images
- small images are shown sorted by category, cluster, and panel. Clicking the image will show it in a larger size. A zoom function shows the full detail of the original image. On the larger images, site or cluster overviews that were annotated as part of the recording will include hyperlinks that may be clicked to show additional detail and data. ![[New window]](/wikidata/newwindow.png) Topo Charts
- one or more graphics show the topography of the site with hyperlinks that will display additional detail and images.
Topo Charts
- one or more graphics show the topography of the site with hyperlinks that will display additional detail and images. ![[New window]](/wikidata/newwindow.png) Panel Reports
- five tabular reports including two graphs. Several fields on the tabular reports are hyperlinks that may be clicked to show additional detail data and images.
Panel Reports
- five tabular reports including two graphs. Several fields on the tabular reports are hyperlinks that may be clicked to show additional detail data and images. ![[New window]](/wikidata/newwindow.png) Element Reports
- four tabular reports including two graphs. Several fields on the tabular reports are hyperlinks and may be clicked to show additional detail and images.
Element Reports
- four tabular reports including two graphs. Several fields on the tabular reports are hyperlinks and may be clicked to show additional detail and images. ![[New window]](/wikidata/newwindow.png) Survey Recap
- contains thumbnail images of all panels and all elements and a summary of all panel and element data.
Survey Recap
- contains thumbnail images of all panels and all elements and a summary of all panel and element data.
If paper output is desired, The DigitalRockArt application can dump the Survey Report to a PDF formatted file for printing on either monochome or color printers. The digital images can be automatically reformatted to include the typical mugboard data and more. The example below is formatted for 4x6 paper and includes site name and number (both blurred), cluster and panel numbers, date and time of the photo, facing and inclination, panel comments, a metric scale, and a logo arrow indicating the correct orientation. The JPEG images may be taken to commercial photo centers for printing on high quality paper.
 |
In practice, paper output is seldom requested. Viewing images and data via the Internet or a DVD offers many advantages and is significantly less expensive.
Research
The DigitalRockArt application enables users to create ad hoc reports to locate and compare rock art across multiple sites. The following are a few of the research functions available:
- Search by Attributes - select a few attributes (zoomorphic, facing left, antlers) and find every element in the database that matches the selected attributes.
- Facing Analysis creates a tabular report and graph showing the facings and inclinations of the selected elements.
Search for Element Coincidence - similar to Search by Attributes but allows two to five elements to be chosen and will find all panels that match the selection criteria.
- Compare Surveys - there are three different ways to compare survey statistics or images of elements.
- Notebook - enables users to create their own collection of images or elements from any survey in the database. Additional comment fields, check boxes, data fields, and calculations can be defined to supplement the survey data.
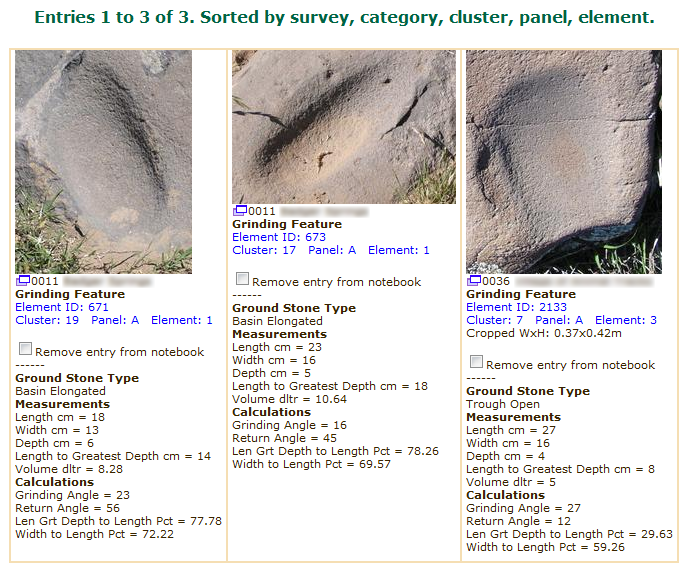
Two examples of notebook entries are shown below. The first example shows a popup window that is displayed when a user selects an element or image to be added to a notebook. Any image or any element in the database may be added to a notebook by clicking on the image/element ID hyperlink. In the example below, several check boxes and data fields have been defined by the user for a study of bedrock metates. Clicking the submit button will add the entry to the user's Metate Study notebook.
The Show Notebook function is used to view the notebook entries. The example below displays three entries from the Metate Study notebook. The entry made above is shown on the right. The Metate Study notebook definitions created by the user included several calculations. The items under Calculations were not shown on the input form, but were calculated based upon the data entered.
 |
Documentation
The wiki pages containing the user manual may be read without logging in. Each function has a corresponding wiki page with example screenshots. If you are a visitor who has not logged in, the Tutorial menu on the left has links to more detailed documentation for each function (you are reading the Introduction).
The biggest challenge to analyzing rock art across sites is the creation of a standardized method of classifying and describing elements. Links to the current attempt at element classifications are described on the left under Attributes. Element classes and attributes are application data and may be changed from time to time.
Computer Recording
More information about how to enter data into the DigitalRockart application is found on IntroToDigitalRockArtPart2.
Contact
For more information, contact digitalrockart@yahoo.com
|
About Our Logo
Our guess is Yavapai, late 1800's. It depicts a young girl running toward us, holding up her hoop dress, pig tails flying.
 DigitalRockArt Wiki